
CEO ECONOMIC OUTLOOK INDEX
The Business Roundtable CEO Economic Outlook Index is based on a survey conducted quarterly since the fourth quarter of 2002.
Business Roundtable Q2 CEO Economic Index in Line with Long-Term Average, Reflecting a Stable U.S. Economy
Large Majority of CEOs Say New, High-Standard Trade Agreements Are Key to Competitiveness
Washington – Business Roundtable today released its Q2 2024 CEO Economic Outlook Survey, a composite index of CEO plans for capital spending and employment and expectations for sales over the next six months.
The overall Index decreased slightly by 1 point from last quarter to 84 and is nearly at its historic average of 83. CEO plans for capital investment are down marginally, and expectations for sales are up modestly from last quarter. Additionally, plans for hiring remain the same as in the first quarter.
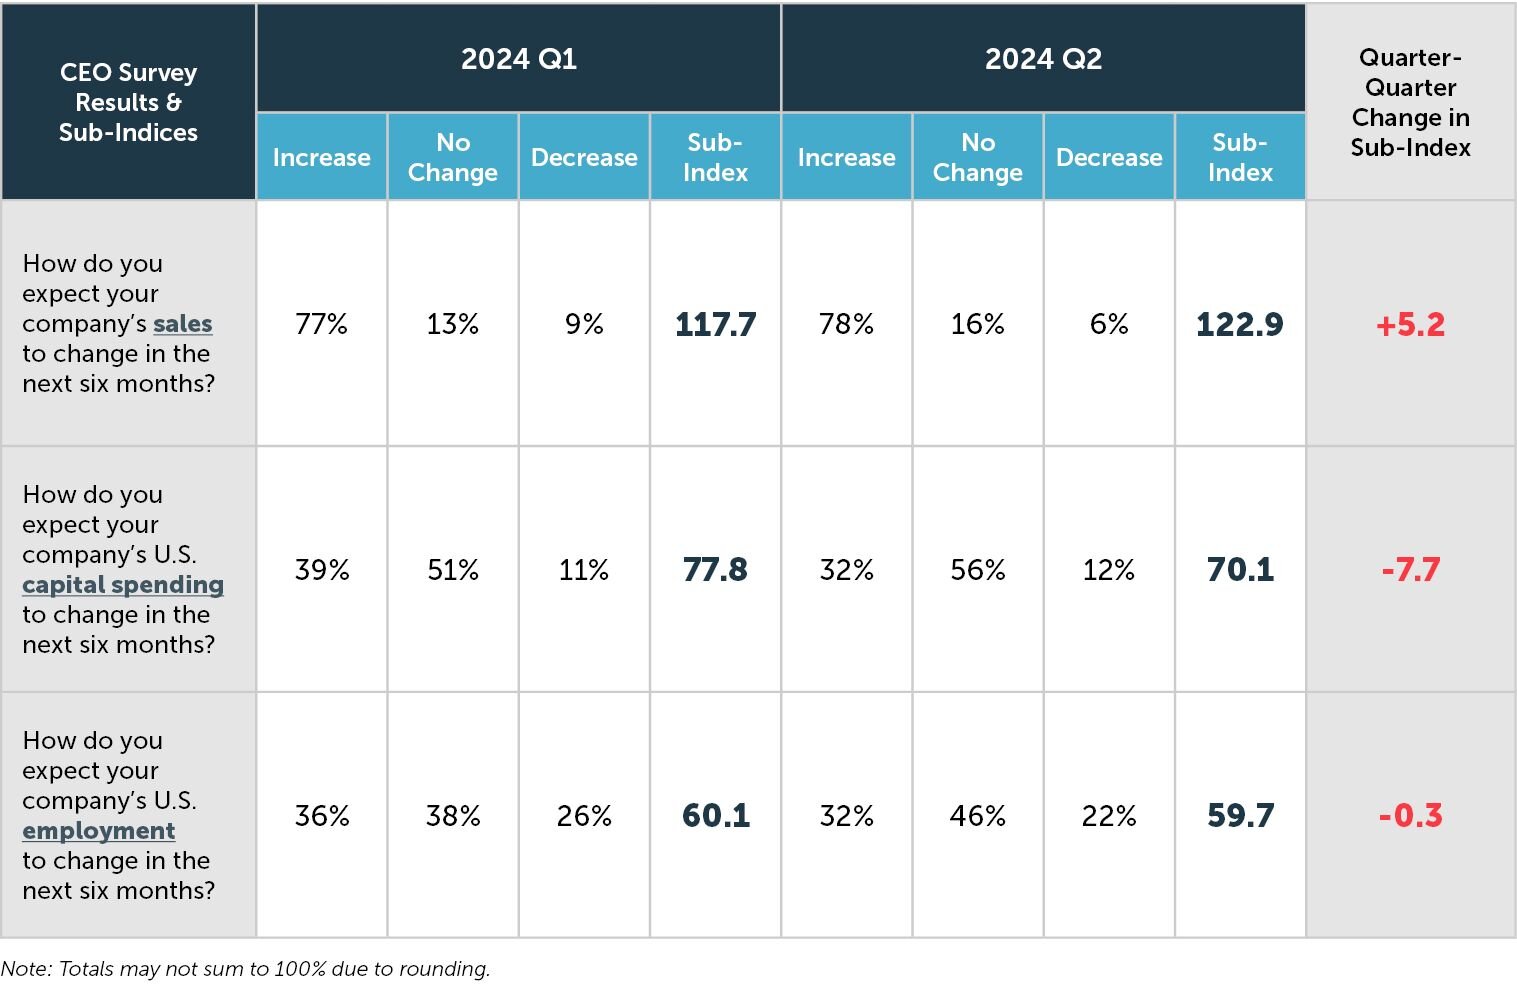
The Survey’s three subindices were as follows:
- Plans for hiring held flat, maintaining a value of 60.
- Plans for capital investment decreased 8 points to a value of 70.
- Expectations for sales increased 5 points to a value of 123.
In their third estimate of 2024 U.S. GDP growth, CEOs projected 2.3% growth for the year, up from the 2.1% growth projected last quarter.
“The overarching message from our member CEOs is that the economy is steady and stable, but they remain cautious,” said Business Roundtable Chair Chuck Robbins, Chair and Chief Executive Officer of Cisco. “To drive growth, create opportunities for all Americans and strengthen our global competitiveness, it will be more important than ever for Washington to protect and expand the economic gains from tax reform, modernize America’s workforce development system, lead on responsible deregulation to lower costs, and solidify high-standard trade agreements.”
In a special question posed this quarter, CEOs were asked about their views on trade. Roughly 86% of CEOs agree or strongly agree that securing new, high-standard trade agreements is critical to maintaining U.S. competitiveness.
“A large majority of Business Roundtable CEOs believe that expanding trade is essential to U.S. economic growth and competitiveness,” said Business Roundtable CEO Joshua Bolten. “Our international competitors are forging ahead with new trade agreements while the U.S. sits on the sidelines. It’s time to promote trade agreements that will help American businesses and workers compete in the global economy.”
This quarter’s survey was in the field from May 22 through June 6, 2024. In total, 144 CEOs completed the survey.
CEO Outlook
Capital Expenditures
Employment
Sales Expectations
About the Business Roundtable CEO Economic Outlook Survey
The Business Roundtable CEO Economic Outlook Survey, conducted quarterly since the fourth quarter of 2002, provides a forward-looking view of the economy by Business Roundtable member CEOs. The survey is designed to provide a picture of the future direction of the U.S. economy by asking CEOs to report their company’s expectations for sales and plans for capital spending and hiring over the next six months. The data are used to create the Business Roundtable CEO Economic Outlook Index and sub-indices for sales, capex and hiring. These indices are diffusion indices that range between -50 and 150 — where readings at 50 or above indicate economic expansion, and readings below 50 indicate economic contraction. A diffusion index is defined as the percentage of respondents who report that a measure will increase, minus the percentage who report that the measure will decrease. The diffusion indices here are then normalized by adding 50 to the result.