
CEO ECONOMIC OUTLOOK INDEX
The Business Roundtable CEO Economic Outlook Index is based on a survey conducted quarterly since the fourth quarter of 2002.
CEO ECONOMIC OUTLOOK INDEX
The Business Roundtable CEO Economic Outlook Index is based on a survey — conducted quarterly since the fourth quarter of 2002 — of our member CEOs’ plans for hiring and capital spending, and their expectations for sales, over the next six months. Taking these factors together, the survey signals the direction of the U.S. economy.
Business Roundtable CEO Economic Outlook Index Rises in Q1 2026
CEOs Report Stronger Plans and Expectations for Sales and Capex Over the Next Six Months
Washington – Business Roundtable today released its Q1 2026 CEO Economic Outlook Survey, a composite index of CEO plans for capital spending and employment and expectations for sales over the next six months.
The overall Index increased by nine points from last quarter to 89, above its long-term historic average of 83. CEOs reported higher numbers across all three subindices. Notably, the capex and sales subindices are in expansion territory while the employment subindex is neutral.
This quarter’s survey was in the field from February 23 through March 6, 2026. For context, the U.S. Supreme Court decision on the International Emergency Economic Powers Act tariffs was on February 20, and the ongoing military operation in Iran began on February 28. In total, 169 CEOs completed the survey.
“The survey shows stronger CEO expectations for sales and capital investment over the next six months, despite global uncertainty. The results point to the impact of last year’s tax reforms, responsible deregulation and the resilience of the U.S. economy,” said Business Roundtable Chair Chuck Robbins, Chair and Chief Executive Officer of Cisco. “We look forward to continuing our work with the Trump Administration and Congress in the months ahead to advance policies that will drive long-term growth.”
The Survey’s three subindices were as follows:
- Plans for hiring increased 9 points to a value of 50.
- Plans for capital investment increased 12 points to a value of 91.
- Expectations for sales increased 6 points to a value of 126.
Values above 50 signal growth, while values below 50 signal contraction.
“This quarter’s survey shows a notable improvement in CEO sentiment,” said Business Roundtable CEO Joshua Bolten. “The rise in the headline index is encouraging, especially the solid gains in sales and capex, but the employment picture remains a concern, with as many CEOs planning to reduce employment as increase it. Policymakers can help strengthen economic and employment conditions by reforming permitting and providing greater certainty on trade, including extending the U.S.-Mexico-Canada Agreement.”
CEO Outlook
Capital Expenditures
Employment
Sales Expectations
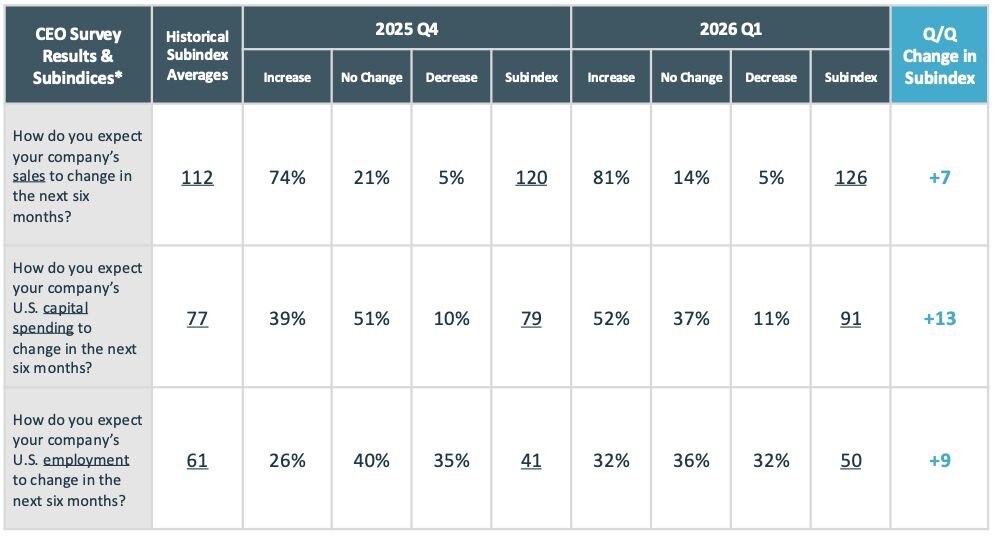
How do you expect your company's sales to change in the next six months? | ||||
|---|---|---|---|---|
| Increase | No Change | Decrease | Subindex | |
| Q4 2025 | 74% | 21% | 5% | 120 |
| Q1 2026 | 81% | 14% | 5% | 126 |
| Quarter-to-Quarter Change in Subindex | +6 | |||
How do you expect your company's U.S. capital spending to change in the next six months? | ||||
|---|---|---|---|---|
| Increase | No Change | Decrease | Subindex | |
| Q4 2025 | 39% | 51% | 10% | 79 |
| Q1 2026 | 52% | 37% | 11% | 91 |
| Quarter-to-Quarter Change in Subindex | +12 | |||
How do you expect your company's U.S. employment to change in the next six months? | ||||
|---|---|---|---|---|
| Increase | No Change | Decrease | Subindex | |
| Q4 2025 | 26% | 40% | 35% | 41 |
| Q1 2026 | 32% | 36% | 32% | 50 |
| Quarter-to-Quarter Change in Subindex | +9 | |||
*Note: Totals may not sum to 100% due to rounding. Quarter-to-quarter change is calculated from rounded values.
Data Table Download
CEO Outlook
Capital Expenditures
Employment
Sales Expectations
About the Business Roundtable CEO Economic Outlook Survey
The Business Roundtable CEO Economic Outlook Survey, conducted quarterly since the fourth quarter of 2002, provides a forward-looking view of the economy by Business Roundtable member CEOs. The survey is designed to provide a picture of the future direction of the U.S. economy by asking CEOs to report their company’s expectations for sales and plans for capital spending and hiring over the next six months. The data are used to create the Business Roundtable CEO Economic Outlook Index and subindices for sales, capex and hiring. These indices are diffusion indices that range between -50 and 150 where readings at 50 or above indicate economic expansion, and readings below 50 indicate economic contraction. A diffusion index is defined as the percentage of respondents who report that a measure will increase, minus the percentage who report that the measure will decrease. The diffusion indices here are then normalized by adding 50 to the result.