
CEO ECONOMIC OUTLOOK INDEX
The Business Roundtable CEO Economic Outlook Index is based on a survey — conducted quarterly since the fourth quarter of 2002 — of our member CEOs' plans for hiring and capital spending, and their expectations for sales, over the next six months. Taking these factors together, the survey signals the direction of the U.S. economy.
Business Roundtable Q2 CEO Economic Outlook Index Increases for Fourth Consecutive Quarter
Sales Expectations and Capex Plans Strongest in Over Four Years, While Hiring Holds Near Neutral
Washington – Business Roundtable today released its Q2 2026 CEO Economic Outlook Survey, a composite index of CEO plans for capital spending and employment and expectations for sales over the next six months.
The overall Index increased by two points from last quarter to 91, its highest reading since Q4 2024 and well above its historic average of 83. The gain was driven by stronger CEO expectations for sales and plans for capital investment. Hiring plans remained in neutral territory, with about as many CEOs indicating they intend to decrease employment at their companies as increase it.
"For the fourth straight quarter, CEO sales expectations and capital investment plans remain above average, reflecting the continued resilience of the economy," said Business Roundtable Chair Chuck Robbins, Chair and Chief Executive Officer of Cisco. "However, consumers and businesses continue to face some headwinds. Washington can help build confidence and drive growth by extending the U.S.-Mexico-Canada Agreement, modernizing permitting and adopting a federal framework for AI regulation that protects U.S. technology leadership."
The Survey's three subindices were:
- Plans for hiring increased one point to a value of 51.
- Plans for capital investment increased two points to a value of 93.
- Expectations for sales increased three points to a value of 129.
Values above 50 signal growth, while values below 50 signal contraction.
"Over the past year, the survey has shown ongoing divergence between capital spending and hiring plans," said Business Roundtable CEO Joshua Bolten. "As AI and other forces reshape the workforce, Business Roundtable member companies are investing in training programs to help employees succeed. It is increasingly important for policymakers to support that work by modernizing the federal workforce development system."
This quarter’s survey was in the field from June 2 through June 12, 2026. In total, 167 CEOs completed the survey.
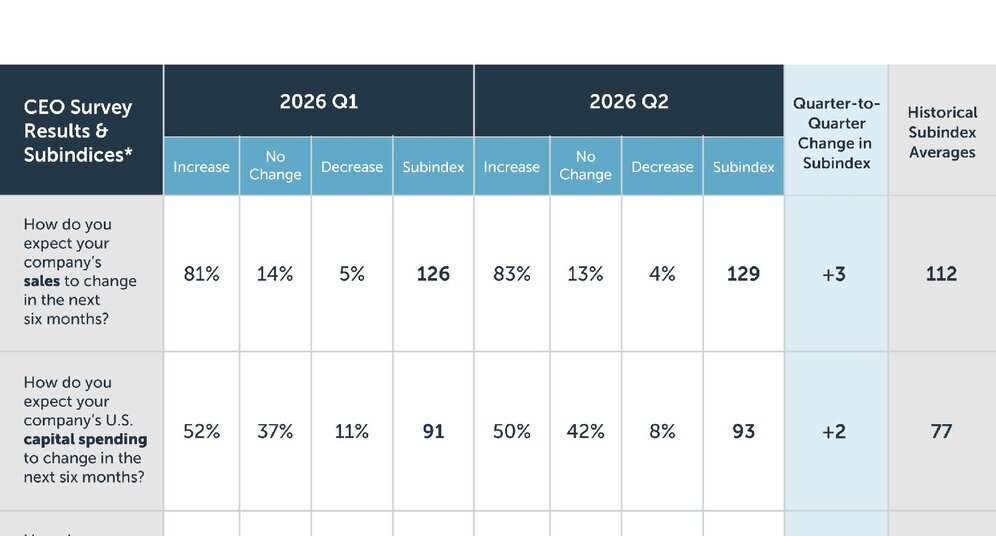
How do you expect your company's sales to change in the next six months? | ||||
|---|---|---|---|---|
| Increase | No Change | Decrease | Subindex | |
| Q1 2026 | 81% | 14% | 5% | 126 |
| Q2 2026 | 83% | 13% | 4% | 129 |
| Quarter-to-Quarter Change in Subindex | +3 | |||
| Historic Average of Subindex | 112 | |||
How do you expect your company's U.S. capital spending to change in the next six months? | ||||
|---|---|---|---|---|
| Increase | No Change | Decrease | Subindex | |
| Q1 2026 | 52% | 37% | 11% | 91 |
| Q2 2026 | 50% | 42% | 8% | 93 |
| Quarter-to-Quarter Change in Subindex | +2 | |||
| Historic Average of Subindex | 77 | |||
How do you expect your company's U.S. employment to change in the next six months? | ||||
|---|---|---|---|---|
| Increase | No Change | Decrease | Subindex | |
| Q1 2026 | 32% | 36% | 32% | 50 |
| Q2 2026 | 30% | 40% | 30% | 51 |
| Quarter-to-Quarter Change in Subindex | +1 | |||
| Historic Average of Subindex | 61 | |||
*Note: Totals may not sum to 100% due to rounding. Quarter-to-quarter change is calculated from rounded values.
Data Table Download
CEO Outlook
Capital Expenditures
Employment
Sales Expectations
About the Business Roundtable CEO Economic Outlook Survey
The Business Roundtable CEO Economic Outlook Survey, conducted quarterly since the fourth quarter of 2002, provides a forward-looking view of the economy by Business Roundtable member CEOs. The survey is designed to provide a picture of the future direction of the U.S. economy by asking CEOs to report their company's expectations for sales and plans for capital spending and hiring over the next six months. The data are used to create the Business Roundtable CEO Economic Outlook Index and sub-indices for sales, capex and hiring. These indices are diffusion indices that range between -50 and 150 where readings at 50 or above indicate economic expansion, and readings below 50 indicate economic contraction. A diffusion index is defined as the percentage of respondents who report that a measure will increase, minus the percentage who report that the measure will decrease. The diffusion indices here are then normalized by adding 50 to the result.